
← All projects
Research
Urban Traffic Congestion Analytics: Probe Data & CCTV
Analysing 264 million traffic observations across Jakarta, Bandung and Semarang, then building a prototype that turns city CCTV into a congestion map of the whole road network.
- traffic observations
- 264M
- road segments analysed
- 18,694
- CCTV vehicle detections
- 230k
- probe vs CCTV correlation
- 0.50–0.74
The challenge
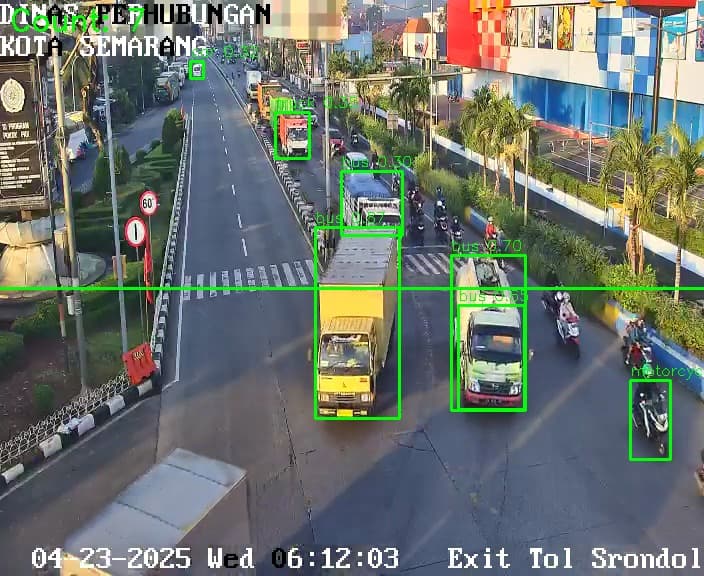
Cities have two traffic data sources, each incomplete. Commercial probe data (HERE) covers every major road but reports an abstract “jam factor” that isn’t calibrated to Indonesia’s motorcycle-heavy traffic, and its segment IDs change between snapshots. CCTV counts real vehicles, but only at a handful of intersections.
Our approach
- Probe data: 11 months of HERE Traffic data at 15-minute intervals for three cities, matched to the OpenStreetMap road network (OSMnx) so every segment has a stable ID.
- Spatial statistics: Moran’s I, LISA and Gi* hotspots, H3 hexagonal aggregation and road-network centrality to separate the effects of time and place.
- Semarang prototype: vehicle detection and tracking with YOLOv8 + DeepSORT on the city’s CCTV streams, joined with HERE data per OSM segment and 15-minute window to calibrate the jam factor into real vehicle density.
Results
- Time of day drives congestion far more than location in the road network, and the evening peak is about 40% more congested. The implication is that travel-demand management beats adding infrastructure.
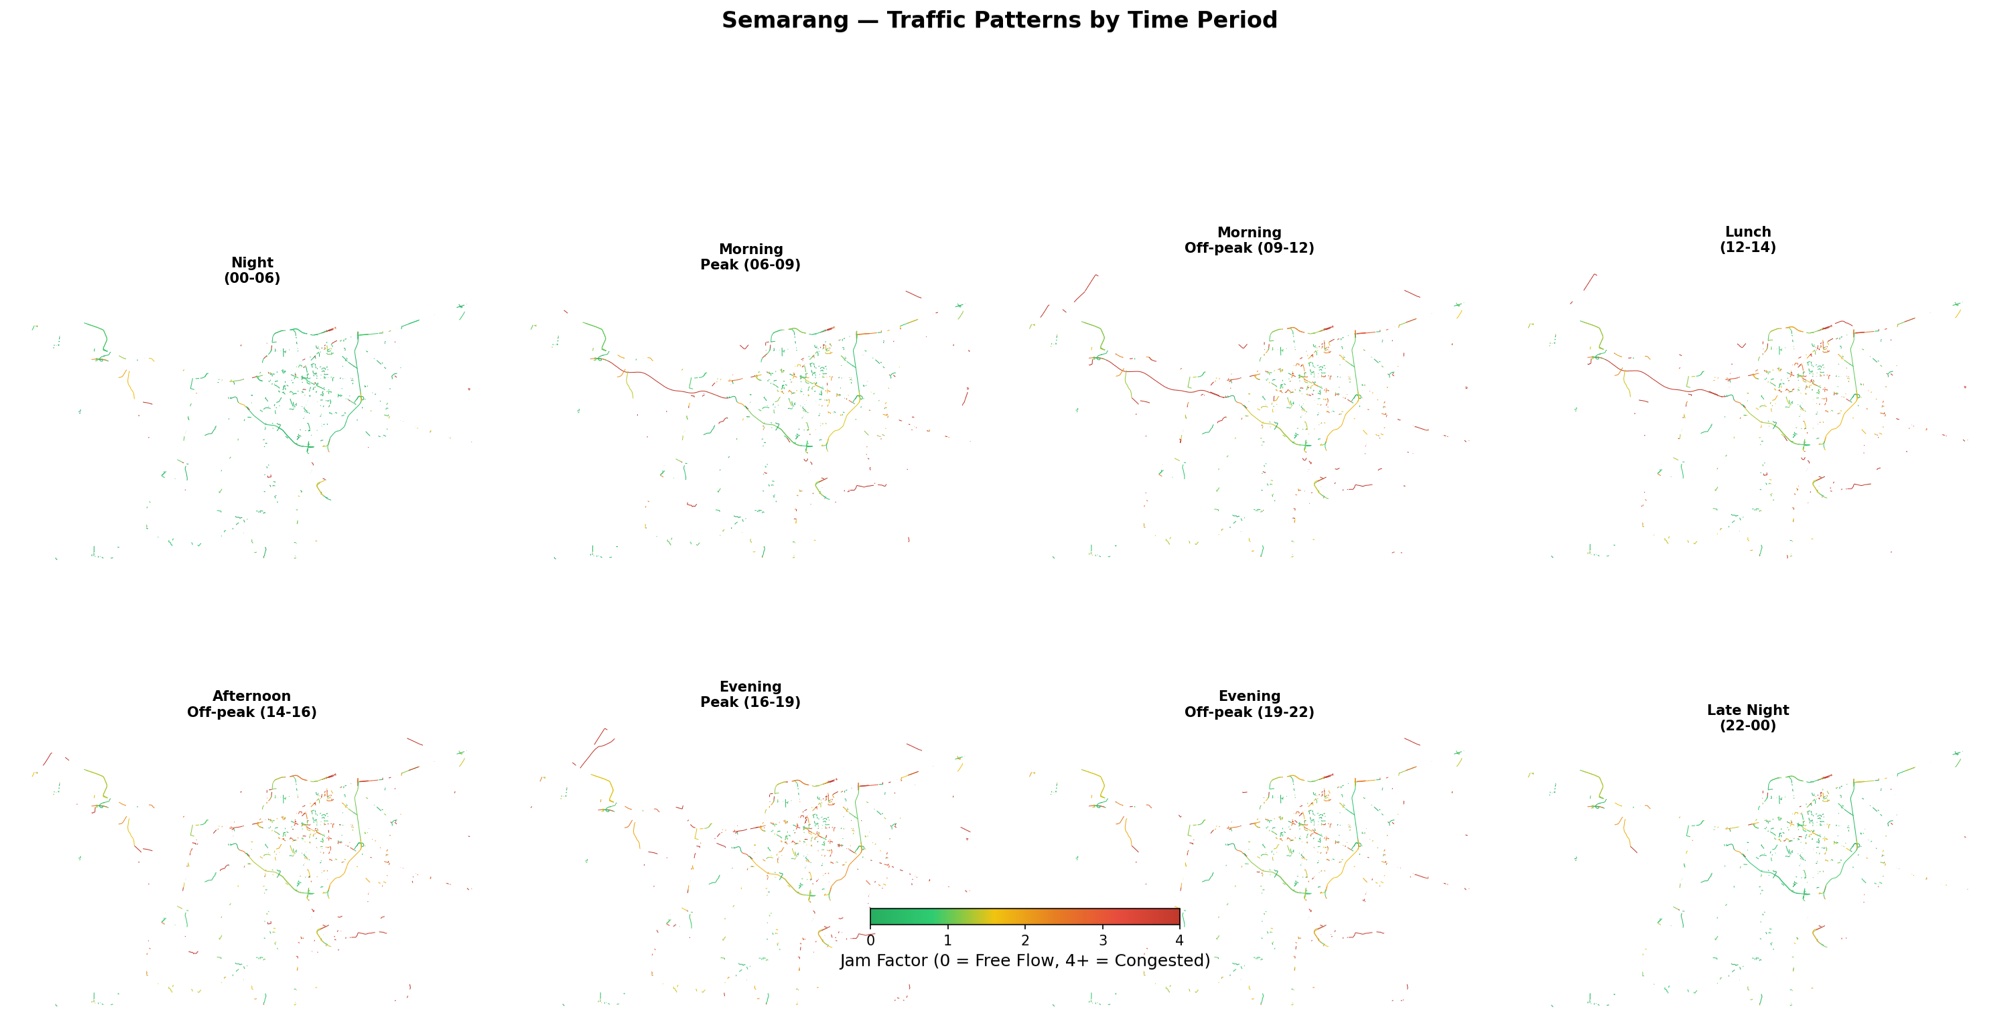
- Congestion hotspot maps by time period for all three cities.
- In Semarang, 230,754 vehicle detection records produced 1,537 paired observations from 8 cameras. HERE’s jam factor moves with measured density at every camera (Spearman correlation 0.50–0.74).
- Next step: a real-time congestion map for ~5,000 road segments in Semarang.
Photos
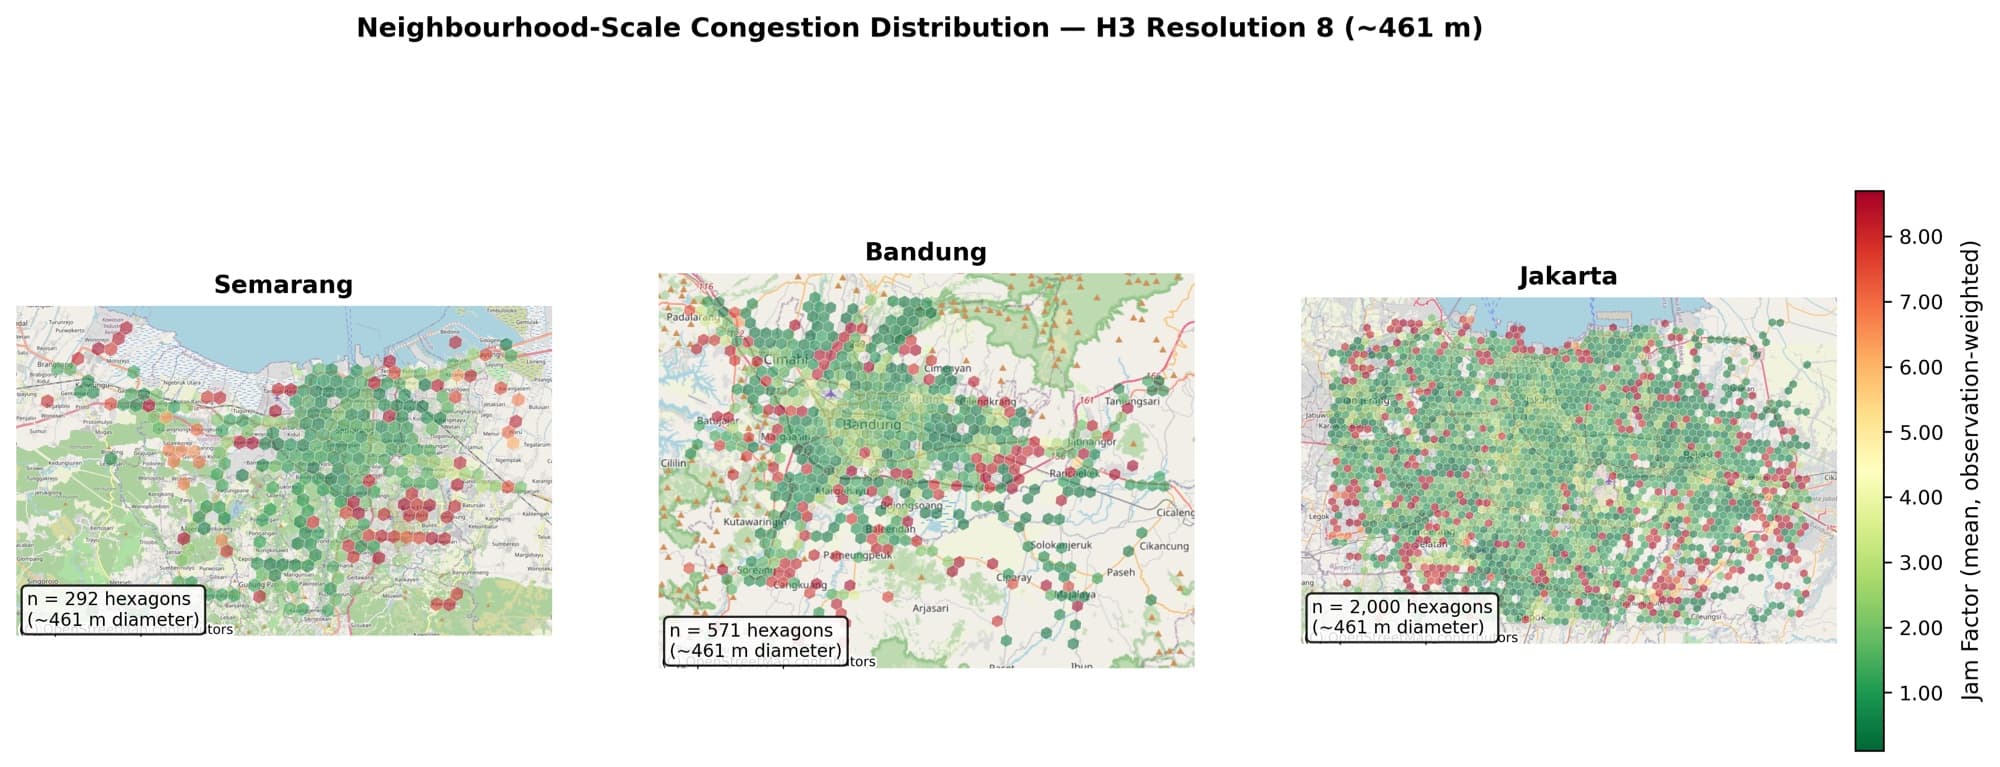
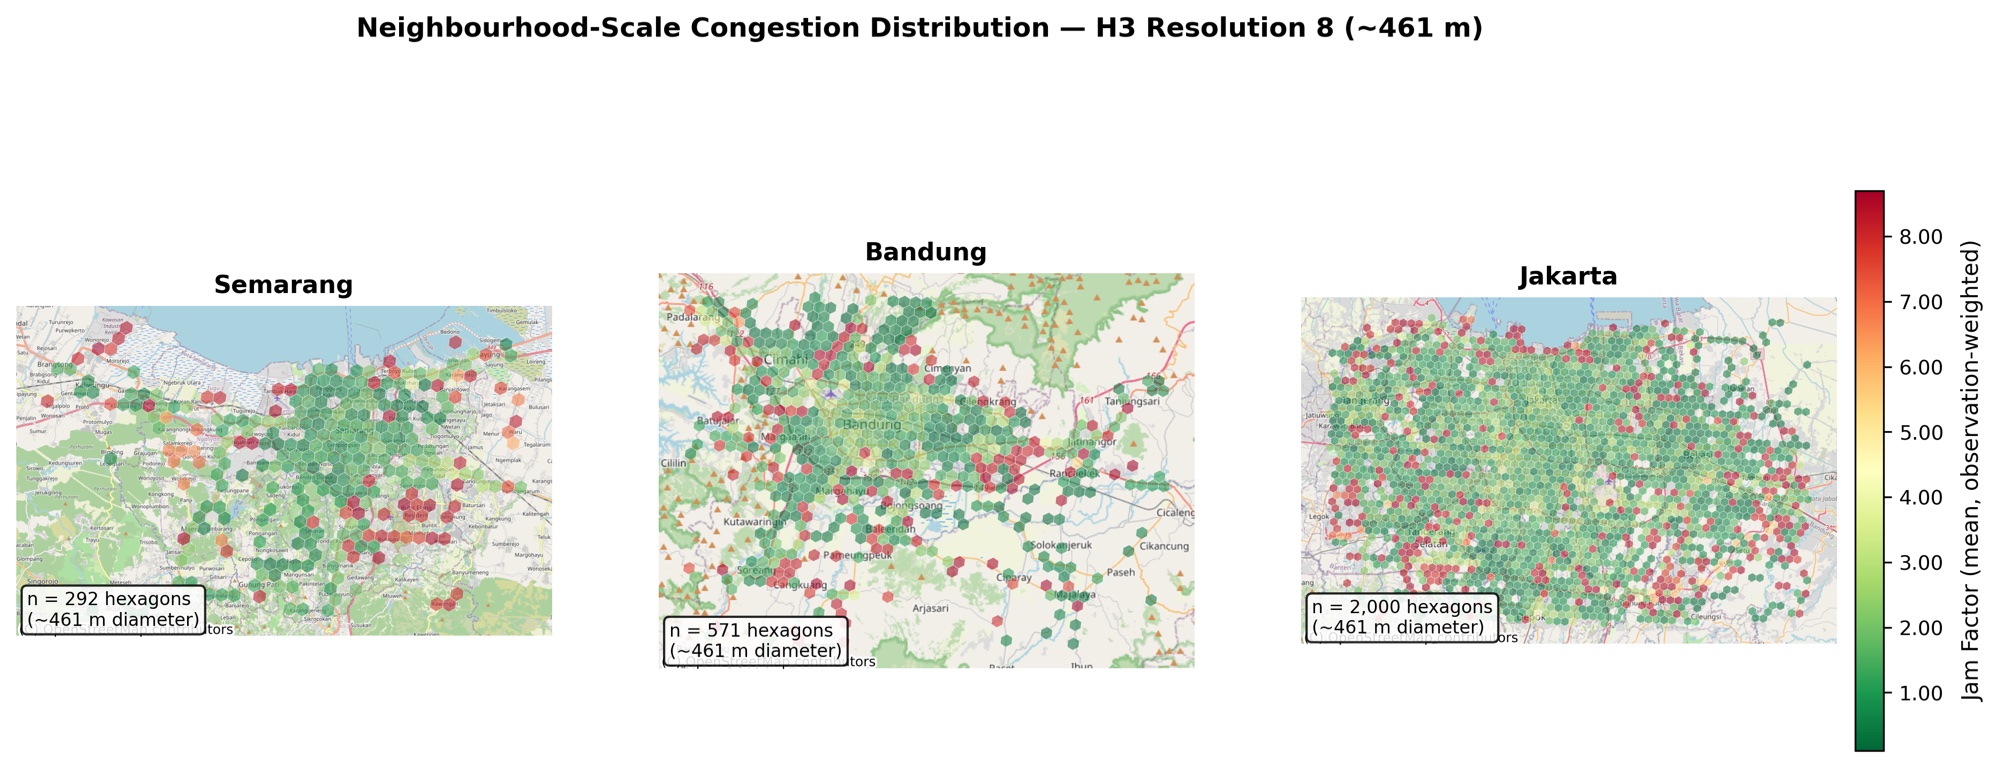
Neighbourhood-scale congestion (H3 grid, ~461 m) in Semarang, Bandung and Jakarta 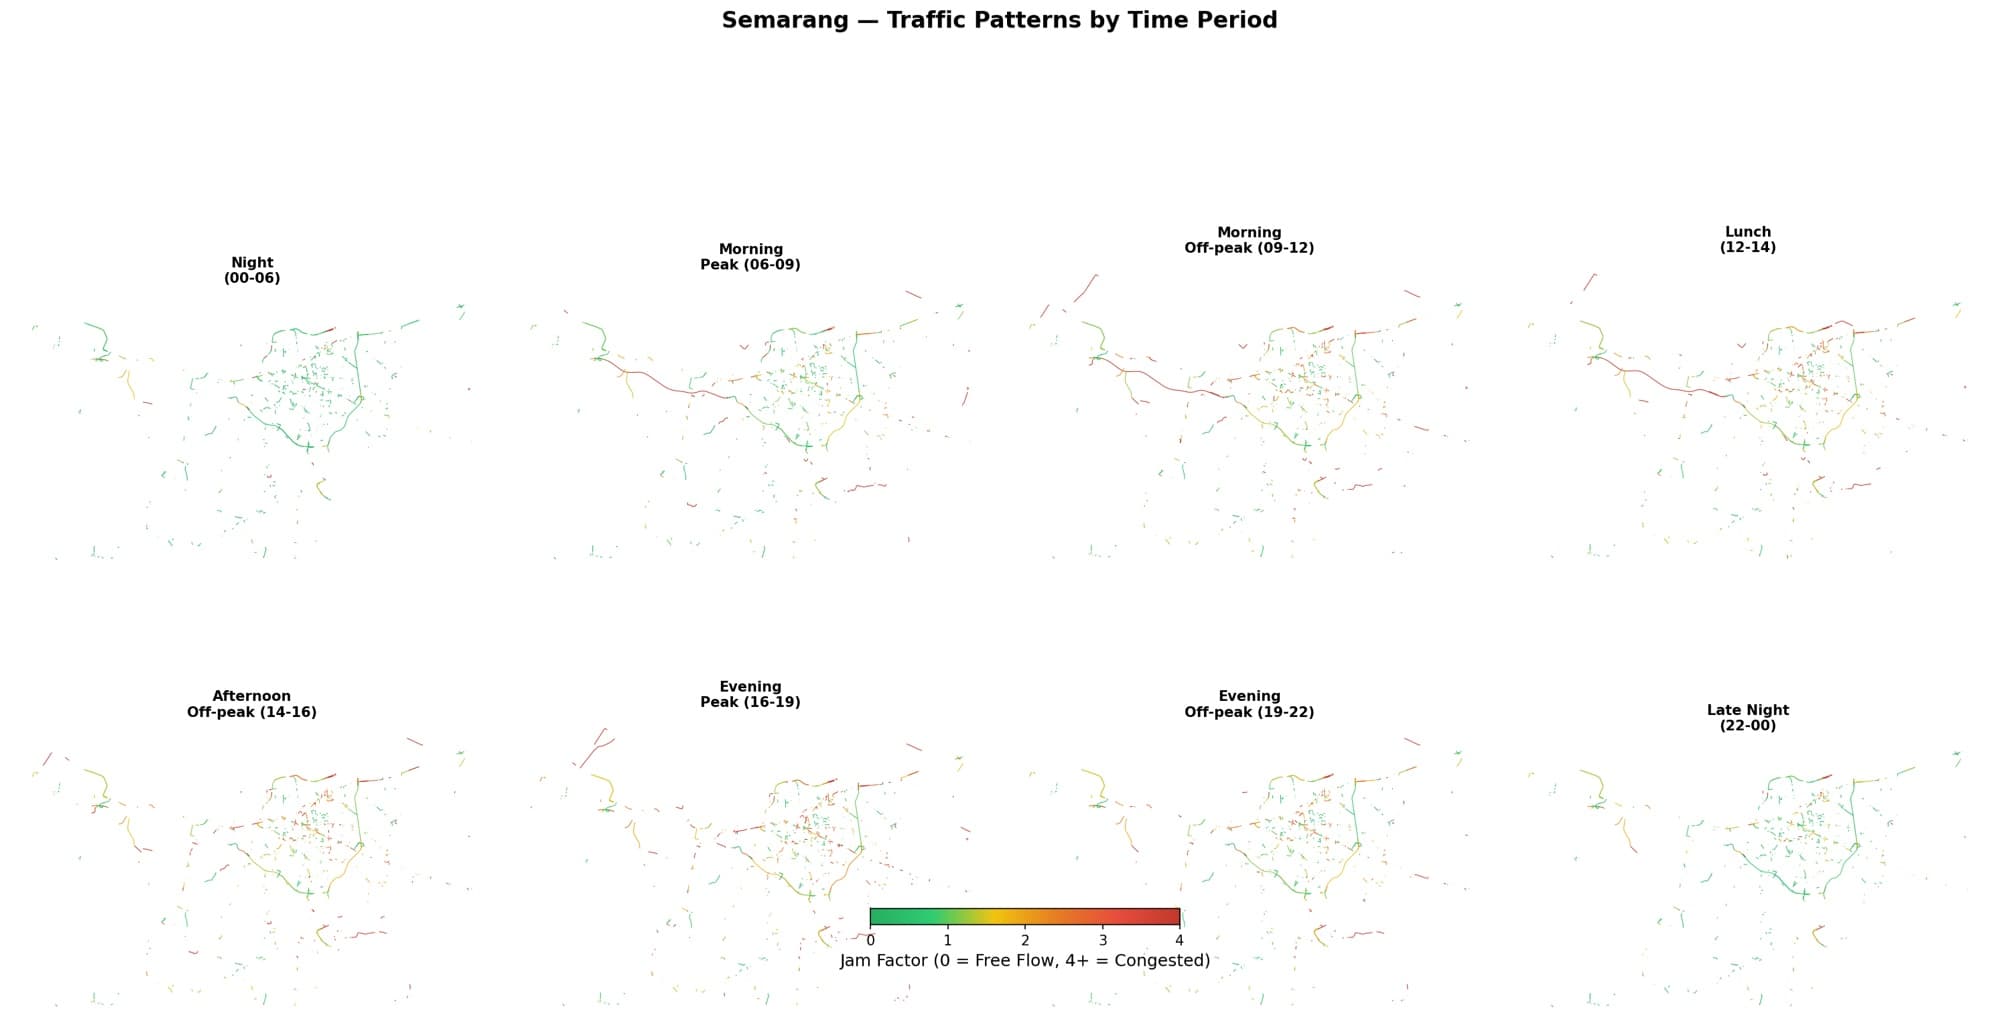
Semarang traffic patterns by time period, from night to evening peak
Working on something similar?
Tell us what you need — we can help from field survey and analysis through to training your team.